

World Mining for Renewables (9 of 20): METALS for SOLAR PV & WIND Energy Global Marketplace
This post is the ninth edition of a 20 posts collection with the analysis in describing the connection of Renewables (Solar PV & Wind) world market with the Mining industry (extractive industries). We will check the production of metals, industrial and construction minerals to build solar modules and windmills around the world. At the end of the article, you can find the links to the other pieces of the collection.
The Solar & Wind Energy marketplace for next 5 years (2018 - 2022) will require 128.3 million tonnes of metals, the 30% of total mineral requirements for this market
Main Results
In the following article, we will analyze specific metals and industrial minerals; however, in the present section, we are focused on the requirements for metals to build world solar PV and wind energy facilities.
Tones of Metals
Solar PV and Wind Energy market will require a large number of metals and metallurgical coal to produce steel, see next table:
Five years forecast (2018 – 2022)
The Solar & Wind Energy marketplace for next five years (2018 – 2022) will require 128,3 million tonnes of metals and 53.56 million tonnes of metallurgical coal totaling 178.45 million tonnes:
- Solar-grade Silicon: 3.4 million tonnes, the 2.67% total metals
- Ferrous metals: 108.78 million tonnes of Iron Ore meaning the 84.78% of total metals.
- Base Metals: 15.72 million tonnes, the 12.26% of total metals
- 10.62 million tonnes of Aluminium, meaning the 1.72 % of total metals.
- 5.1 million tonnes of Copper, 2.16% of total metals.
- Precious Metals: 16,840 tones of Silver meaning the 0.01% of total metals
- Minor Metals: 366,274 tones for others (Electric & Electronic devices), the 0.29% of total metals

Business Metals Market Size for Solar PV & Wind Energy (2018-2022)
Based on November 2017 market commodity prices, the business market size for the metals commodities for solar PV and wind energy market by the 2018 – 2022 period (both included) will be up to:
- 141,158 USD million distributed in the following submarkets …
- Ferrous Metals (Iron Ore): 7,723 USD million, up to 5.47% of the total metals business market.
- Solar-grade Silicon: 63.313 USD million up to 44.85% of the total metals business market.
- BASE Metals: 58,363 USD million up to 36.12% on the total metals business market
- Aluminium: 22,433 USD million, meaning the 17% of the overall metals business market.
- Copper: 35,930 USD million, 27.22% of the total metals business market.
- Precious Metals (Silver): 9,179 US million, the 6.5% of the total metals business market.
- Others (minor metals for Electric & Electronic devices): 2,581 USD Million, the 6.5% of the total metals business market
- plus 8,035 USD million for Metallurgical Coal involved in the production of the steel need for Solar PV and Wind energy facilities
Market Distribution Evolution (2015 – 2022)
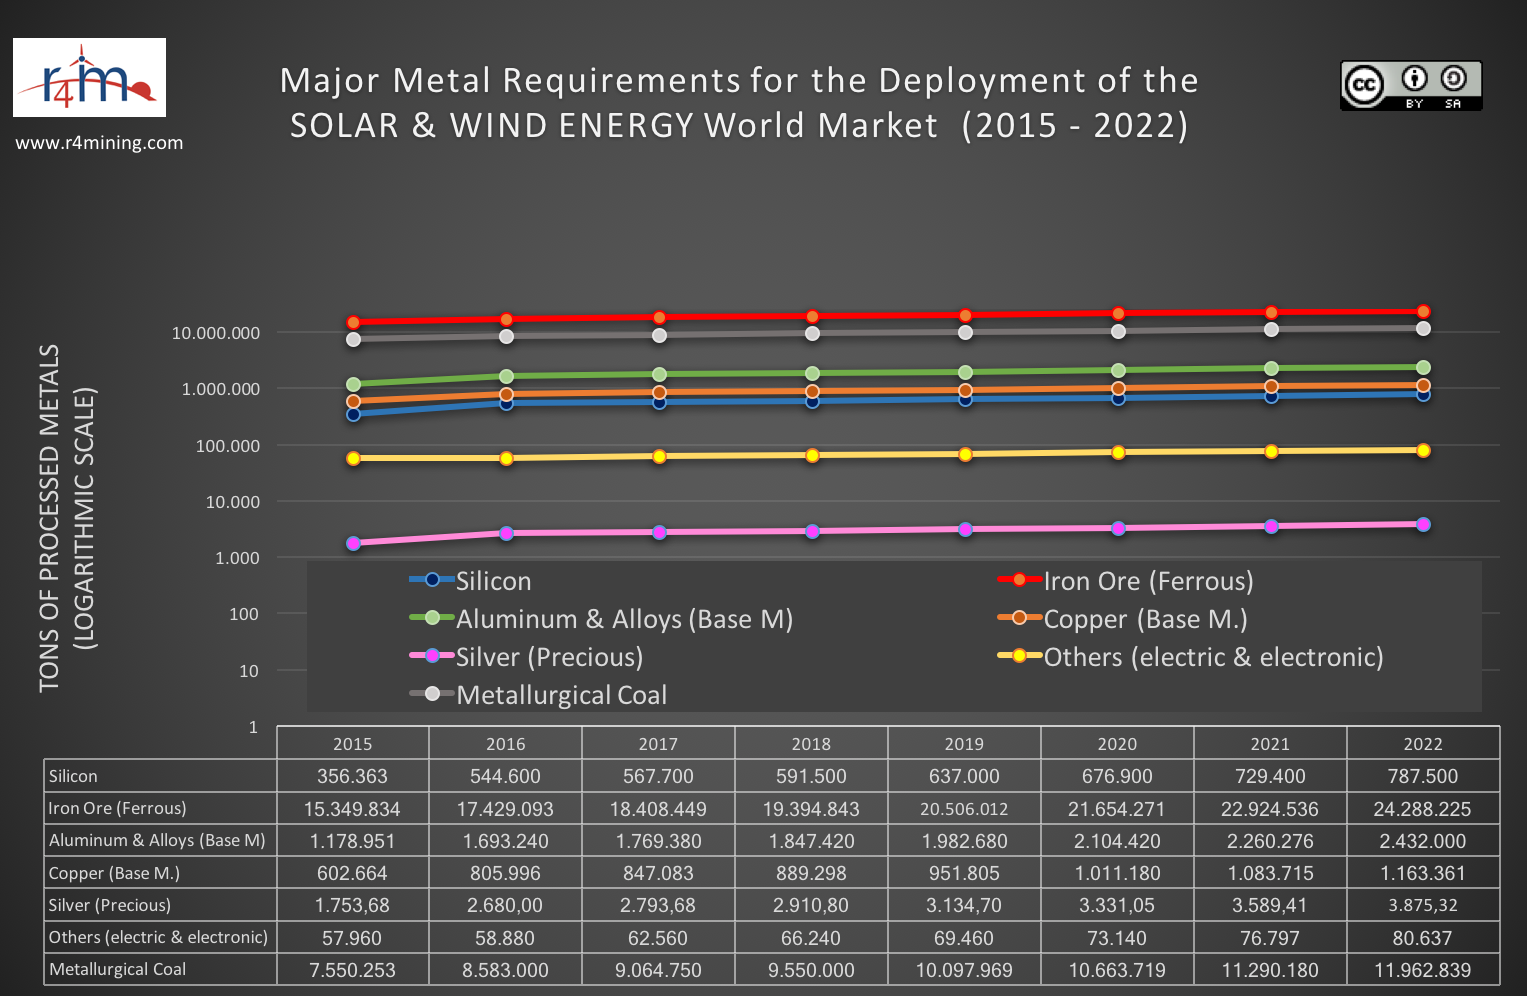
The following image illustrates the five years forecast for the metals and metallurgical coal (pay attention to the logarithmical scale in the vertical axis):
Market Distribution
Significant metals requirements for Solar PV & Wind energy market results (2015-2022) illustrates four levels of size:
- Level 10 million tonnes: Iron Ore and Metallurgical Coal
- Level 1 million tonnes: Aluminium, Copper, and Silicon
- Level 100 thousand tonnes: minor metals linked to electric & electronic devices
- Level «going to» 10 thousand tonnes of Silver.
Market Evolution
- Silicon: 365 thousand tonnes in 2015 to 787.5 by 2022
- Iron Ore: 15.3 million tonnes in 2015 to 24.3 by 2022
- Aluminum: 1.12 million tonnes in 2015 to 2.43 by 2022
- Copper: 0.6 million tonnes in 2015 to 1.16 by 2022
- Silver: 1.75 thousand tonnes in 2015 to 3.87 by 2022
- Others (Electric & electronic): 57.96 thousand tones (2015) to 80.63 thousand tonnes (2022)
- Metallurgical Coal: 7.55 million tonnes in 2015 to 11.96 million tonnes by 2022
Methodological note
1. Determination of composition for Wind Energy material Components
Following two images, source IRENA 2017 data and Vestas 2015, we build an equivalent matrix between tonnes of minerals and metals with MWp for solar and wind energy facilities. The item «oil derived products» includes plastics.
Wind Energy Materials composition

Solar PV Materials composition (IRENA)

Metals business for Solar PV & Wind Energy markets between 2015 to 2022 will reach 141,158 USD million
2. Determination of Energy for significant common materials,
Energy, including fuel and electricity, for strong elements involving the needs for minerals and metals, is a complex subject for discussion. We have to include not only the energy requirements for mining but also to transform into other products as metals or glass. We use the following source of information to determine the energy to take (on average) to produce 1 kilogram of the following materials in Lower Tech Magazine.
A. Involving Ferrous Metals
- Steel (from recycled steel): 6-15MJ (1,665 to 4,170 watt-hours)
- Steel (from iron): 20-50MJ (5,550 to 13,900 watt-hours)
- Iron (from iron ore): 20-25MJ (5,550 to 6,950 watt-hours)
- The composition of Steel:
- Ratio Iron Ore to Steel: 1.25
- Ratio Metallurgical Coal to Steel: 0.625
B. Involving Base Metals
- Aluminum (from 100 % recycled aluminum): 11.35-17MJ (3,150 to 4,750 watt-hours)
- Aluminum (from a typical mix of 80% virgin and 20% recycled aluminum): 219 MJ (60,800 watt-hours)
- Aluminum (from bauxite): 227-342MJ (63,000 to 95,000 watt-hours)
- Nickel (from ore concentrate): 230-270MJ (63,900 to 75,000 watt-hours)
- Copper (from sulfide ore): 60-125MJ (16,600 to 34,700 watt-hours)
C. Involving Precious Metals
- The Silver Institute is the data source for Silver size and market evolution.
- About 10% of global application of Silver deals to the Solar PV modules as Ross Beaty confirmed in the conference of Mines & Money Americas last October 2017.
- USGS Geological Survey 2017 for Silver
D. Involving Industrial Minerals
- Silicon (from silica): 230-235MJ (63,900 to 65,300 watt-hours)
- Electronic grade silicon (CVD process): 7,590-7,755MJ (2,108,700 to 2,154,900 watt-hours).
- Glass (from sand, etcetera): 18-35MJ (5,000 to 9,700 watt-hours). Quartz is
- Plastics (from crude oil): 62-108MJ (17,200 to 31,950 watt-hours)
- Titanium (from ore concentrate): 900-940MJ (250,000 to 261,000 watt-hours)
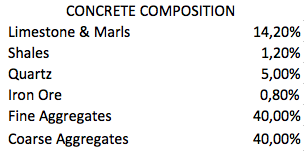
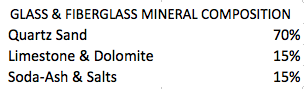
E. Involving Construction and Industrial Minerals
- Composition of Concrete, Glass, and Fiberglass

3. Balance previous data with Solar PV and Wind Energy market facilities
We adjust the precedent data with Solar PV and Wind Energy market data. Sourcing:
- Wind Energy Market data: World Wind Energy Association 2016 and 2017
- Solar PV Data: GTM Research 2017
- Components of Solar PV and Wind Energy: IRENA
Previous Posts
- World Mining for Renewables (1 of 20): The SOLAR PV Market
- World Mining for Renewables (2 of 20): The WIND Energy Market
- World Mining for Renewables (3 of 20): The SOLAR PV & WIND Energy Markets
- World Mining for Renewables (4 of 20): Mineral & Metal Resources for SOLAR PV Marketplace
- World Mining for Renewables (5 of 20): Mineral & Metal Resources for WIND Energy Marketplace
- World Mining for Renewables (6 of 20): Mineral & Metal Resources for SOLAR & WIND Energy Markets
- World Mining for Renewables (7 of 20): METALS for SOLAR PV Global Marketplace
- World Mining for Renewables (8 of 20): METALS for WIND ENERGY Global Marketplace
Next Post (10 of 20)
Under following article (10 of 20), we will analyze the demands for NON-METAL MINING for Global SOLAR PV Marketplace.
LinkedIn Group: Renewable Energy for Mining and Oil:
If you are interesting about these topics (Renewable Energies, Energy Storage, Electric Vehicles), please you are welcome to participate in the LinkedIn group about
“Renewable Energy for Mining and Oil Industry”
